Walk away with answers. Not slides.
Every PMO-MI® engagement ends with interactive dashboards, a tailored report, and a prioritised transformation roadmap.
24 domains. Dual-scored. One canvas.
Every domain mapped on the same canvas — strengths and gaps obvious at a glance.
You vs industry vs everyone.
Where to invest first.
Highlights the domains requiring the most attention.
Benchmarks that give context.
Board-ready narrative. Underlying data. Tailored to you.
Maturity and impact level for each of the 24 service domains. Plus an overall score with developing / significant / strategic banding.
Key insights, scores and benchmarks.
Consolidated multi-PMO maturity and impact view.
Maturity levels by country and by industry — and growing.
Each domain visualised with red/orange/green banding. Strengths and weakest links obvious at a glance.
Prioritized recommendations for improvement, tailored to your context.
Future-state operating model including structure, roles, services and governance.
Sequenced initiatives with owners, KPIs and quarter-by-quarter delivery plan.
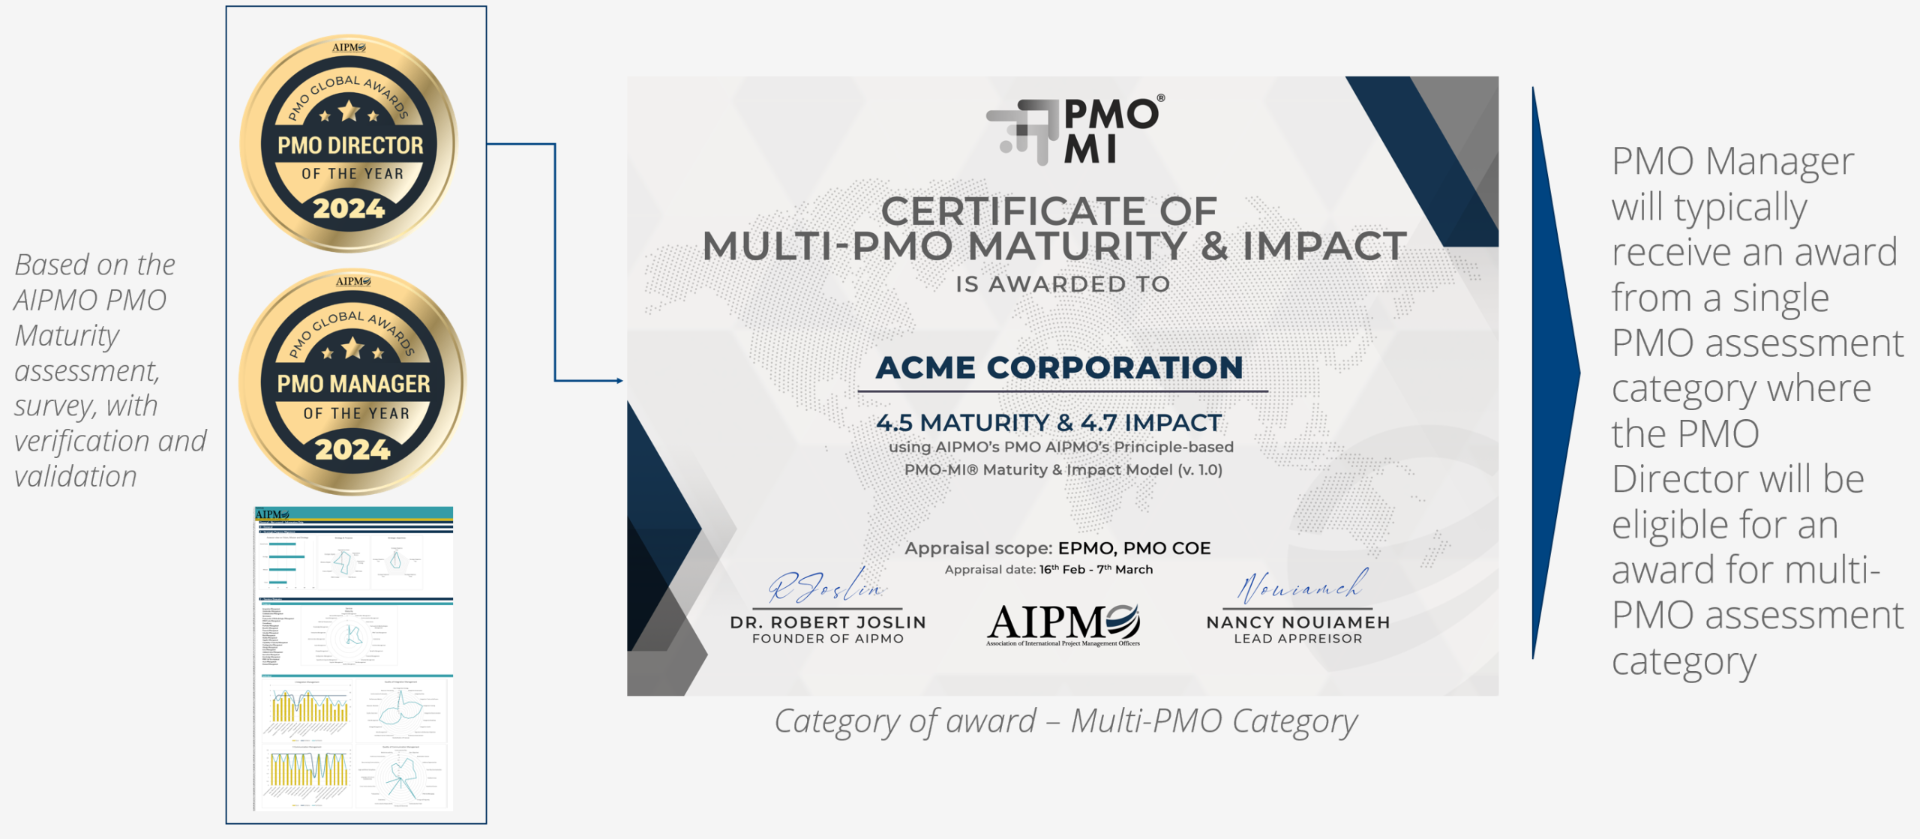
And a verifiable certificate.
Signed by AIPMO's founder and a lead appraiser. Scope, dates, final maturity and impact scores.